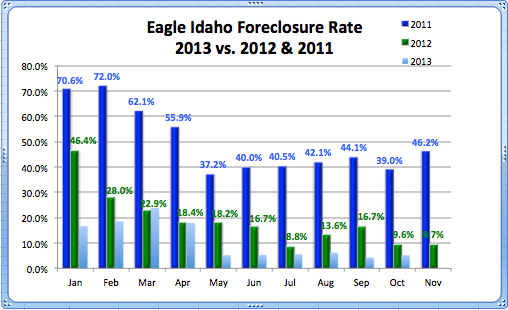
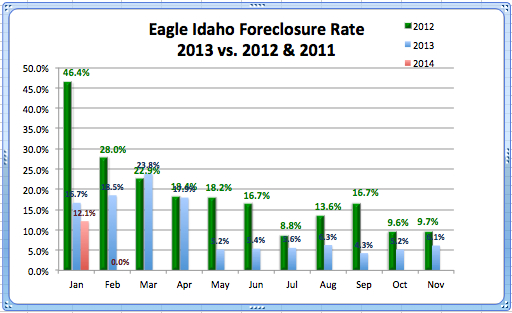
The Eagle, Idaho foreclosure rate fell to 0% February of 2014, a miraculous low among Ada County cities- unheard of for the last several years. As you can see in the graph above, the foreclosure rate was 12.1% in January and 0% in February; 18.5% lower than last February and 28% lower than 2012. In the last two and a half years the foreclosure rate started at 46% in January 2012 and dropped all the way down to 0%, a remarkable decline.
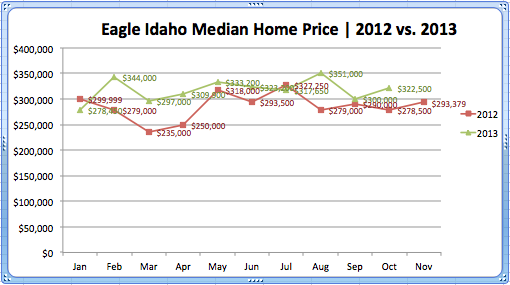
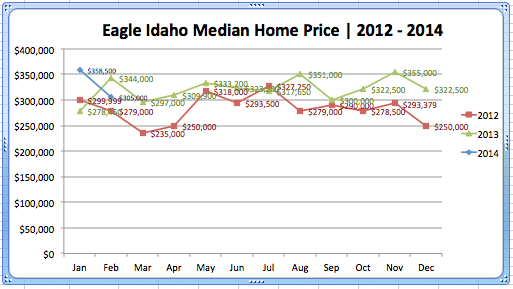
Not only was the foreclosure rate non-existent in February 2014, but the median home sales price is also staying in a competitive range. As you can see in the graph below, 2014 started with the highest median sales price in years at $358,500. Home value in Eagle is steadily rising- you can see that last January the median was $278,450. In one year it increased by 29%. Granted, median home sales prices vary month to month but you can see that each year the median line has risen from the previous years.
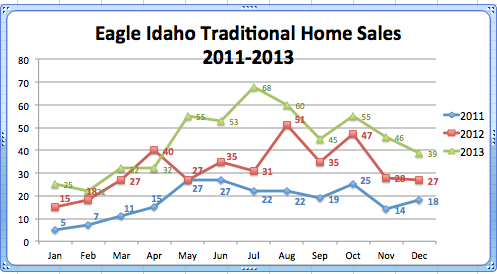
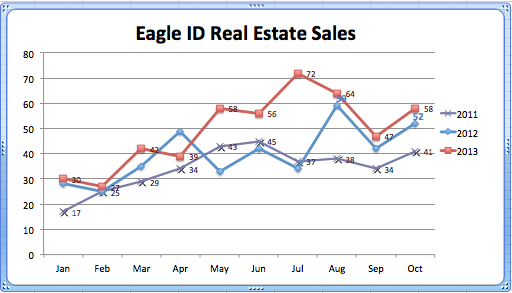
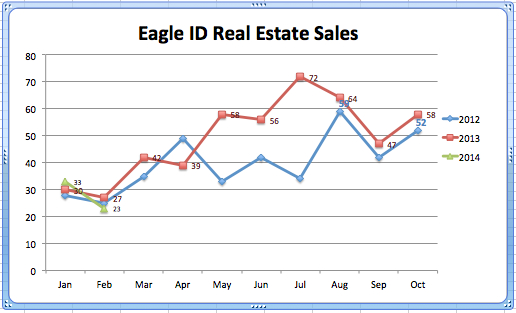
Real estate sales were slightly lower in February ’14, 23 homes sold- a slight decrease of only 1.7%. However; in January sales were higher than they have been in the past three years. This is a strong start for Eagle 2014 real estate. Historically, sales are lower the start the year and climb to a peak through the warmer/summer months (reflected in the graph below).
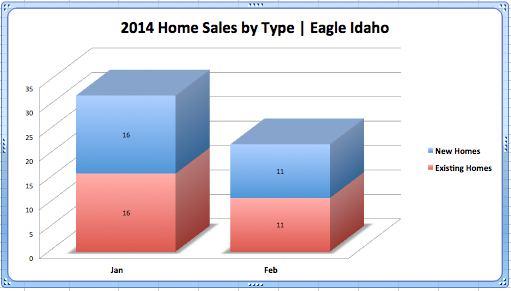
Among the homes sold in Idaho this year, there has been a miraculous balance between new and existing the last couple of months in Eagle; much more balanced than in other cities throughout the County. Only 24% of home sales were new construction in Meridian February ’14, and only 31% of home sales were new construction in Boise. As you can see in the graph below, both January and February had an equal 50:50 ratio between new and existing home sales.