Eagle Idaho Real Estate | Market Update Oct. ’13

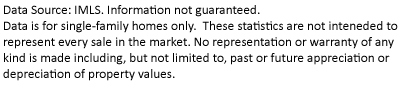
As you can see in the graph below Eagle, Idaho real estate sales are higher this year than they were in 2011 and 2012. In October there were 58 homes sold in Eagle compared to 52 sold in October of the previous year. That’s an 11% increase, which shows sales are continuing to increase in a stabilized market. At the peak of the market in July of this year, 72 homes were sold in Eagle, which is a 111% increase from 2012. It then slightly decreased for a couple of months, which is normal in late summer. It has since then picked back up this Fall.

Real Estate Sales Eagle 2011-2013

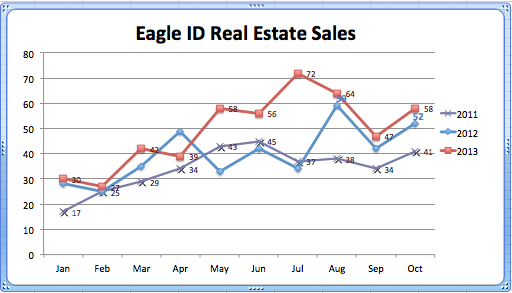
Along with an increase in real estate sales in 2013, the median home sales price has also increased. In October of 2013 the median home sales price was $322,500. In Comparison to October of 2012, the median home sales price was $278,500, which is an increase of 11.5%. In January of 2013 the median home sales price was $278,450 and increased steadily through the year by about 16%. The average median home sales price in 2013 is 12% higher than the average median home sales price from 2012.

Eagle Median 2012 vs. 2013

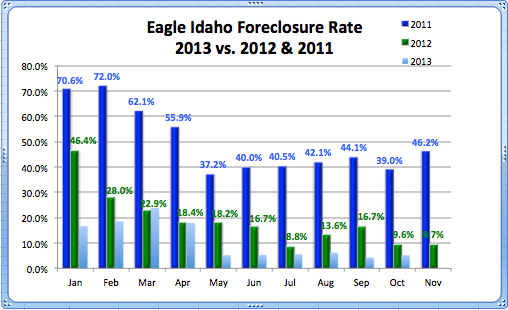
As you can see in the graph below, the Eagle Foreclosure rate has dropped tremendously in the last 3 years. In January of 2011 there was a 70.6% foreclosure rate compared to 5.2% in October of 2013. In the last three years the foreclosure rate has dropped 65.8%. This year alone the foreclosure rate has dropped from 16.7% in January to 5.2% in October. Between 2011 and 2013 we went from an unhealthy market with a very high foreclosure rate, to a healthy and stabilized market with a very low foreclosure rate.

Foreclosure Rate Eagle 2011-2013

Disclaimer

Eagle Idaho Real Estate | Jan. – June 2012

Home sales in the Eagle Idaho real estate market for January through June 2012 were fairly consistent with 2011 sales, although May and June of 2012 showed decreases over 2011 sales of 23.2% and 6.6%, respectively.

Eagle Idaho Real Estate Sales | Jan. - June Comparison

The most significant differences in the sale of real estate in Eagle Idaho are found in the decreasing number of foreclosure sales.  As illustrated in the graph below, in January 2012, there were 6 Eagle Idaho foreclosures compared to 8 in 2011. By May 2012, only 1 of the 33 Eagle ID real estates ales was a foreclosure, and in June only 3 of the 42 sales were foreclosures, much lower than the 10 of 43 and 15 of 45 recorded in May and June 2011.

Eagle Idaho Foreclosures | 2011 & 2012 Comparison

As a comparison, the market share of foreclosures on the Eagle Idaho real estate market for the months of January through June, 2009 to 2011, have generally been between 24% and 55%, with a high of 55% in January 2010 and a low of 24.1% in both May 2010 and March 2011. In 2012, though, we see a totally different trend. In January 2012, the market share of Eagle Idaho foreclosures was 21.4%. Although this represents the highest market share in 2012 to date, it is still below the lowest market share recorded for January through June for the last 4 years.  Since January there has been an almost steady decline to a record low foreclosure market share of 3.0% in May and 4.7% in June.

Eagle Idaho Foreclosures | 2009-2012 Comparison

disclaimer

Eagle Idaho Real Estate Market Stats

The Eagle ID real estate market in 2011 is about even with last year in terms of closings.  As you can see from the graph below, sales are above ’08 & ’09 levels.

Eagle Idaho Real Estate Sales

While there are fewer distressed properties on the market in Eagle they still attract the majority of sales.  In March ’11, 62% of the sales were either Eagle ID Short Sales or Eagle ID Bank-Owned Real Estate.

As of 4/6/11, there are 195 single family homes for sale in Eagle Idaho – 55 are listed as short sales & 15 bank-owned homes.  The majority of these Eagle Idaho foreclosures are in the lower price ranges as the chart below shows.

Percentage of Eagle ID Foreclosures by Price

Here’s a look at just the numbers:

Eagle Idaho Real Estate Total Short Sales REO Percentage
Under $100,000 2 2 0 100%
$100,000 to $200,000 47 24 6 64%
$200,000 to $300,000 47 13 7 43%
$300,000 to $400,000 38 7 1 21%
$400,000 to $500,000 19 2 1 16%
Over $500,000 42 7 0 17%
Total 195 55 15 36%