Traditional Sales Up & Foreclosure Rates Down| Eagle 2013

Eagle Trad. 2011-1013

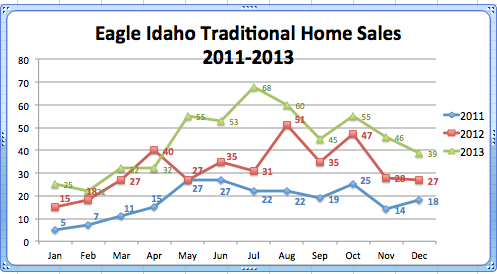
Although there have been similar high’s and lows in real estate sales in Eagle through the past three years, there has been a consistent increase in sales within those expected ups and downs. As you can see in the graph above, there were 39 traditional home sales in December of ’13, a 44% increase since ’12. As you can see, December of 2012 also showed a 50% increase from the year prior; equaling an 84% increase in sales in just two years.

The most dramatic increase in traditional home sale numbers we saw in 2013 were seen in July-  68 homes sold, a 119% increase from July of 2012. Summer was hot for real estate- which was bound to drop slightly. However the rest of the year still had consistent increases in numbers each month compared to 2012.

Eagle New vs. Existing '13

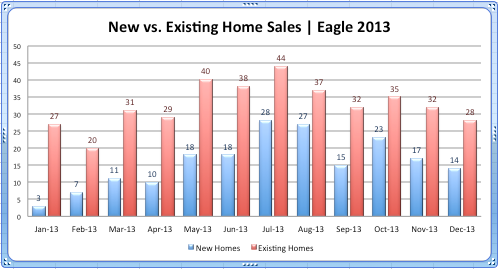
New home sales also increased throughout 2013; the year started with 3 new home sales in January, but ended in December with 14. On average, 32% of home sales were new and 68% were existing in 2013. As you can see however, the proportion was even in December when 50% of the home sales were new. This proportion seems even bigger when considering only 10% of home sales were new in January.

The highest peak we saw for new home sales for 2013 was in July, 28 new homes were sold (39% of home sales that month). Historically the warmer months tend to increase real estate sales, and the colder months (along with different factors such as the school year and holiday season) seem to encourage some potential buyers to wait.

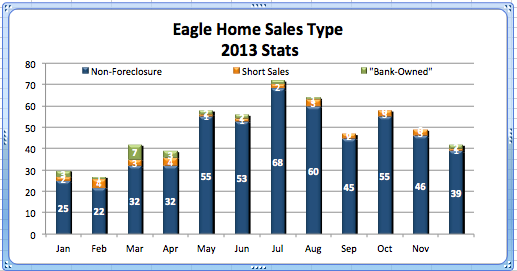
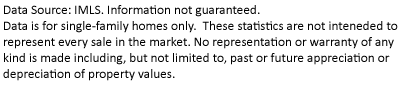
The graph below gives us a clear picture of the proportion of short sales and bank owned homes vs. non foreclosures sold each month. Eagle has the lowest foreclosure rate in Ada county, this low proportion is reflected in the graph below. For example, in December of 2013, there was 1 short sale, 2 bank owned, and 39 non foreclosure sold. That means 93% of sales were traditional, 2% short sales, and 5% were bank owned.

You can see that throughout the entire year those numbers really only varied slightly. The highest foreclosure rate was in March when 7 bank owned homes sold, and 3 short sale homes sold. This means 23% of home sales were foreclosures; the highest we saw all year. The average foreclosure rate in Eagle, 2013 was 10.2% of sales, a 9.5% drop from 2012. The average foreclosure rate in 2012 was 19.7%.

Eagle Home Sales by Type '13

Disclaimer

Eagle ID Real Estate Market Update | September ’12

Eagle ID real estate sales for the months of August and September were higher this year compared to last year at the same time.  In August of last year 38 homes sold compared to 59 this year.  That’s roughly a 36% increase from August of last year.  As you can see in the graph below, the number of Eagle ID real estate sales jumped when comparing September 2011 to Sep. 2012.

Eagle Real Estate Sales 2011 vs. 2012

While the number of home sales in Eagle has gone up, the number of foreclosures has gone down from a year ago.  For example, the foreclosure market share in Sep. 2012 accounted for 16.7% of the Eagle ID real estate sales.  In September 2011, approximately 44% of the sales were foreclosures.  When referring to foreclosures we are talking about bank-owned homes, short sales, and HUD homes.

The same pattern holds true for every month this year compared to last year.  Foreclosures hit their lowest point this year in Eagle during the month of July at 8.8%.  But, they have remained at a steady rate since April 2012.  You can see the entire year-over-year comparison in the graph below.

Eagle Foreclosure Rate 2011 vs. 2012

Disclaimer

Eagle ID Real Estate Sales | 2010 & 2011

Eagle, ID real estate sales were strong beginning May 2011 but fell below 2010 levels in November and December of 2011.  The graph below shows the monthly sales in Eagle Idaho for 2011 compared to 2010.  Sales for the 3rd Quarter of 2011 rose 38% above 2010 levels but dropped 7% below 2010 levels for the 4th Quarter.  For the year overall, residential real estate sales for 2011 were the same as 2010.

Eagle Home Sales for 2010 & 2011

Although 2011 showed virtually no increase in the number of Eagle ID real estate sales when compared to 2010, the median home price in December 2011 was slightly higher than the median price in December of 2010.  As can be seen on the graph below, median home prices are trending upward, especially during the last quarter of 2011.

Eagle Median Sale Price Comparison | 2010 & 2011

Another interesting trend in 2011 was the number of Non-Foreclosure sales compared to Eagle Short Sales and Eagle Bank-Owned property sales.  As depicted below, the majority of real estate sales in Eagle, ID for 2011 were Non-Foreclosures.  In fact, beginning in May, Non-Foreclosure sales accounted for more real estate sales than Short Sales and Bank-Owned properties combined.

Eagle Sales Type for 2011


Eagle Idaho Real Estate | June ’10

The Eagle Idaho real estate market had 34 sales last month. This is up about 6% from a year ago while Ada County as a whole was up 12%.  With 252 homes for sale in Eagle, that’s a 7.2 month absorption rate while the county was at 5.3 months.

Eagle Idaho real estate foreclosures accounted for 56% of the sales in June.  Nine of the 34 sales were short sales and ten were bank-owned.  This is higher than the county overall that had a 41% market share of foreclosures.

While Eagle Idaho foreclosures made up a larger percentage of the sales compared to the county, they actually make up a smaller percentage of the homes currently for sale – at least for bank-owned homes.

Eagle Idaho bank-owned homes currently make up 7% of the homes for sale.  The short sales on the other hand, make up 30% compared to 29% in the county. See the next two graphs:

Search Eagle Idaho real estate, Eagle bank-owned property, and Eagle short sales.

Eagle, ID Real Estate | September 2009

Eagle home sales had another solid month in September, with 38 homes sold.  This is down slightly from the 40 homes sold in August.  The chart below shows total sales for the last five months in the Eagle, ID real estate market:

Eagle, ID real estate total home sales

Out of these 38 homes sold in the Eagle, ID real estate market, 10 of these were bank-owned properties and 9 were Eagle short sales, which makes a foreclosure rate of 50%.  This is a pretty typical percentage for the past five months, as shown in the following graph:

Eagle, ID home foreclosures

Although there was a slight drop in home sales from August to September, the average existing home price in the Eagle, ID real estate market increased by almost $40,000 over this same time.  As the graph below shows, there has been an upward trend in the average prices of houses over the past five months:

Eagle ID real estate average existing home prices

Data source:  Boise MLS (IMLS).  Information not guaranteed.

Eagle Idaho Real Estate| August ’09 Stats

As shown in the graph below, 53% of sold homes in the Eagle Idaho real estate market during August were foreclosures.  This not only makes Eagle foreclosures the highest percentage in Ada County, but more than double the lowest foreclosure rate in Kuna at 24%.

Ada County August Foreclosures

In August, 40 homes sold in the Eagle ID real estate market, the graph below shows that 19 of those were non-distressed, 11 were Eagle short sales, and 10 were Eagle bank owned. Eagle Idaho short sales made up 28% percent of total homes sold in August.

Eagle Home Sales

In the Eagle Idaho real estate market, the best absorption rate can be found in the $200,000-$300,000 price range with a 5.2 month supply. The homes priced between $400,000 and $500,000 has the highest absorption rate at an 18.7 month supply. The average home price in the Eagle Idaho real estate market is $367,336 and the median sold price is $315, 000.

Eagle Absorption Rate

Information deemed reliable but not guaranteed.

Eagle Idaho Real Estate | Eagle Market Stats July ’09

The Eagle Idaho real estate market, like the rest of Ada County, has had increasing home sales and decreasing market share for foreclosures.  The graph below shows the Eagle real estate sales since April where sales have increases 25%.

Eagle Idaho Home Sales

In April, the Eagle Idaho real estate market was made up 60% foreclosure sales (Eagle short sales & Eagle bank-owned homes), while in July, this number decreased to 42.5%.   This compares to 33% market share in Ada County and 25% in Boise.  The graph below shows the Eagle Id real estate foreclosure market trend since April.

Eagle Id Foreclosures

The chart below shows the Eagle Id real estate sales for new homes verses existing along with average and median home prices.

Eagle ID New Home Sales 4 6 6 6
Average Eagle Home Price $ 328,775 $477,233 $334,000 $410,333
Median Eagle Home Price $ 485,000 $600,000 $405,000 $412,250
Eagle ID Existing Homes Sales 26 31 33 34
Average Eagle Home Price $ 292,795 $309,281 $345,412 $387,204
Median Eagle Home Price $ 255,500 $260,000 $310,000 $375,000

Search Eagle Idaho Real Estate.

Data Source: Eagle MLS (IMLS). Information not guaranteed.